Notes, links, and things to think about:
- Hinch et al. 2011. The landscape of recombination in African Americans. Nature 476:170–177, 2011.
- Eberle et al. 2017. A reference dataset of 5.4 million human variants validated by genetic inheritance from sequencing a three-generation 17-member pedigree. Genome Res 27(1):157–164.
- Altemose et al. 2017. A map of human PRDM9 binding provides evidence for novel behaviors of PRDM9 and other zinc-finger proteins in meiosis. Elife 6:e28383.
- Grey et al. 2018. PRDM9, a driver of the genetic map. PLoS Genet 14(8):e1007479.
- Stapley et al. 2017. Recombination: the good, the bad and the variable. Philos Trans R Soc Lond B Biol Sci 372(1736):20170279.
- Protacio et al. 2022 Adaptive control of the meiotic recombination landscape by DNA site-dependent hotspots with implications for evolution. Front Genet 13:947572.
- International HapMap Project
- 1000 Genomes Program
- CEPH panel (note: In the video/audio I said that the DNA is cultured in bacterial artificial chromosomes. This is probably incorrect as there is mention of lymphoblastoid cell lines in this link. It has been a long time since I read any of the documentation on this project!
Biblical Genetics episodes mentioned:
- There is no Y chromosome clock
- Did we evolve from 10,000 people in Africa?
- Was Africa the cradle of humanity?
- Did Eve live in Southern Africa?
- Modern humans from Adam and Eve? You bet!
- Patriarchal Drive
Images:
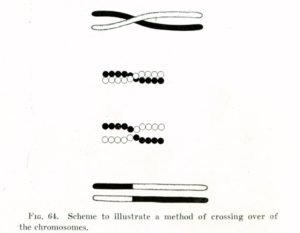
A diagram of crossing over from Thomas Hunt Morgan, circa 1917.
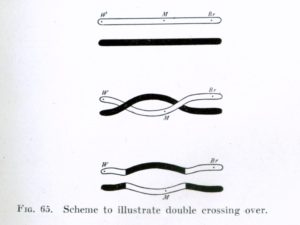
Two consecutive crossings leads to gene conversion (if they are close enough)
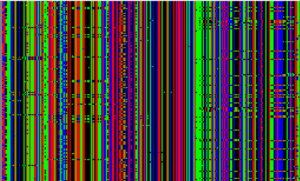
HapMap data, Europeans, Chr 15 spanning the XXX gene. Each individual is represented by a pair of rows. Each column is a single letter in the genome, but the letters are separated by an average of ~1000 nucleotides, so this is not full sequence data.
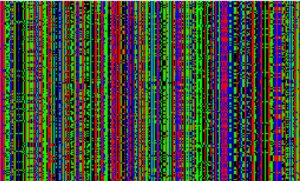
Same as above, but for West Africans.
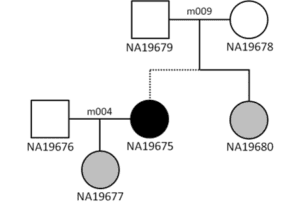
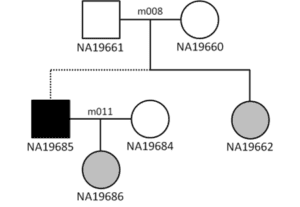
Two accidental three-generation families in the HapMap and 1,000 Genomes datasets. The dotted lines show where the two-parent-child trios connect.
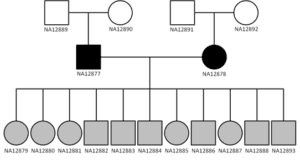
The three-generation, 17-member CEPH panel
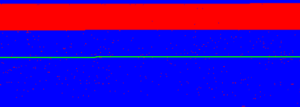
A recombination map of Chr1 for one child (child #5, if I remember correctly). Blue = letters that came from the paternal grandfather. Red = letters that came from the paternal grandmother. Green = a spacer region to represent the position of the centromere.
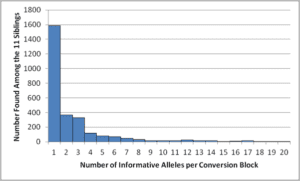
The number of recombined blocks vs the length of each block among the 11 children in the CEPH panel. Note: I totally messed up the explanation (and my hand motions) when I was describing this. I had something else in mind, but after filming, when I went looking for the image I had in my head, I realized my mistake. Either way, it is still an interesting image. It cannot be known how many of the singletons are sequencing errors of 1-SNP gene conversions, but see the Eberle reference above and how they claim to resolve many of the apparent errors.
Podcast: Play in new window | Download

0 Comments